 This is article #23 out of 50 in The Startup Marketing Playbook.
Inbound marketing requires a variety of different content types to appeal to personas in your audience. Some people enjoy reading long ebooks while others prefer watching a webinar. One of the more popular content mediums is infographics: well-designed graphics that visually display data to tell a story.
Infographics have the potential to be virally shared because of their visual appeal and ease of consumption: targets can glance over them quickly to get the idea without applying effort to reading a book or watching a webinar. However, infographics can be difficult to create, especially as a startup. Here is a breakdown of best practices to get started:
1. Identify a data source
The first step in making a great infographic is figuring out where the data is coming from. Industry influencers and trade organizations publish surveys and collect data about industry performance. Especially as a startup, it is often best to partner with one of these folks and give them data credit in the infographic. Look for interesting data that could be displayed visually. Some ideas include:
- % growth in industry trends from last year to this year
- Metrics sorted by type of player (e.g. small business vs. enterprise)
- Popular metrics (e.g. average revenue per customer for your industry)
These are the interesting data points that targets will be intrigued to see visually and thus are more likely to click through to the infographic.
2. Determine how the data can tell a story
An infographic is simply a visual story. It can’t just throw a bunch of numbers on the screen and make them look pretty. You must carefully consider which data points you are including and how they build on each other to tell a story that ultimately supports your product.
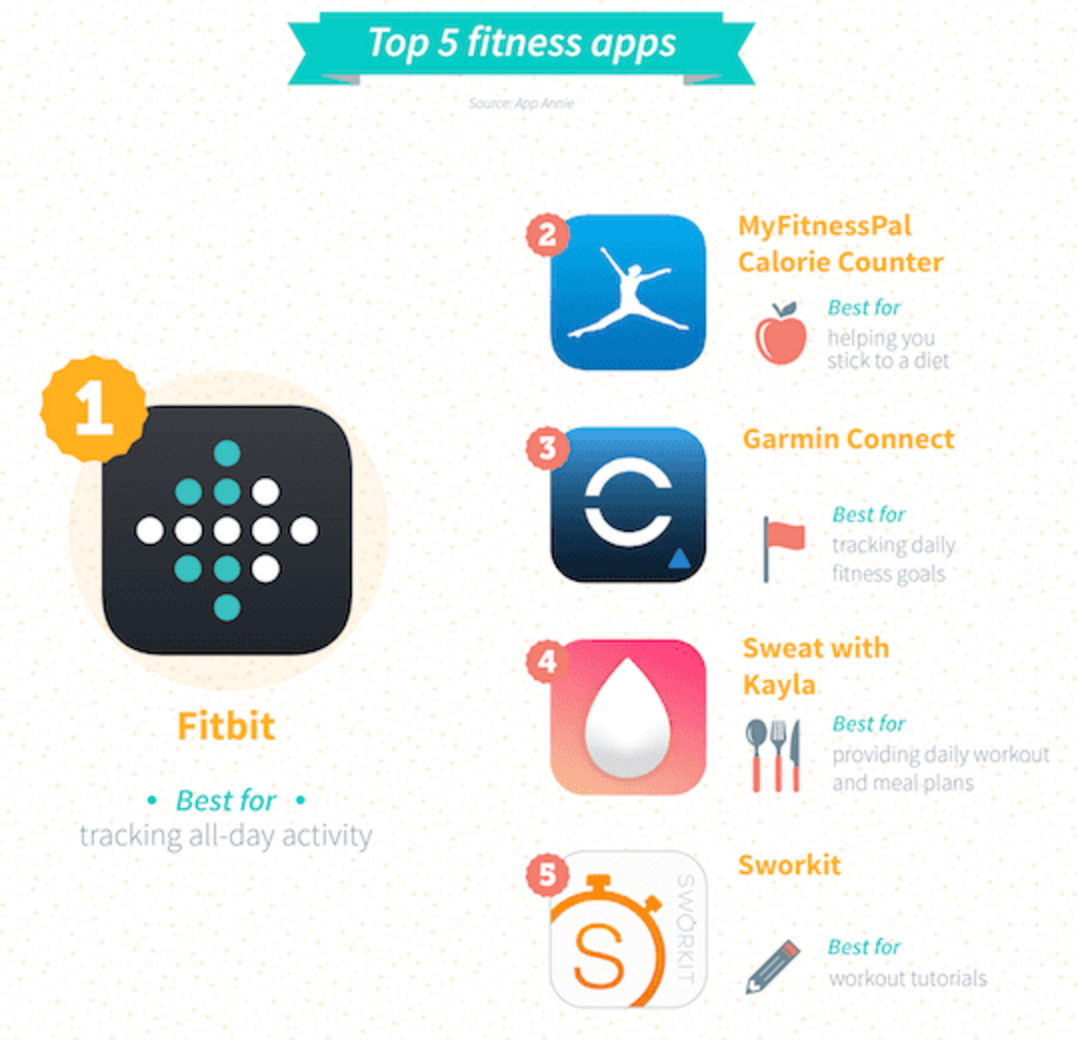
For example, my team has created infographics that show the most popular fitness tracking apps and wearables, which helps to solidify how important technology is in the fitness industry since we are selling a technology product.
3. Define the aesthetic
Each infographic needs a unique aesthetic. What design choices can you make that most effectively highlight the data and tell your story? A few considerations:
- Make the numbers BIG so they immediately pop out
- Minimize sentences and use short labels instead
- Avoid paragraphs except for the introduction
- Use different colors and styles to separate sections in a long, scrolling infographic
4. Use email marketing to drive traffic
Once the infographic is designed, you should use the standard mix of inbound marketing tactics to drive traffic to the content. This includes an email blast, social media posts and blog articles. Remember, your goal is to expose the infographic to as many targets as possible to increase the probability of sharing.
5. Build CTAs into the landing page
The tricky aspect of infographics is that unlike other content mediums (i.e. ebooks), they are not gated. In other words, targets do not need to fill out a form to see an infographic. This makes it more difficult to use infographics to convert targets > leads by capturing their contact information. To address this, you need to build various CTAs into the infographic and its landing page. This typically includes:
- Make the infographic clickable and link to a demo or content page
- Have a CTA button below the infographic that links to a demo or content page
6. Measure results
Once an infographic is launched and driving traffic, it’s time to measure results. As you publish more infographics, it’s valuable to benchmark them and tighten your messaging to appeal best to your targets. Some infographics might be more successful at driving conversions while others might just serve as top-of-funnel awareness pieces.
When you measure attribution of an opportunity or customer, you should use closed loop marketing to determine if your infographic played a role in the journey. How many contacts viewed that infographic and then became opportunities or customers?