This is article #42 out of 50 in The Startup Marketing Playbook.
With the right tools and technology, marketing effectiveness can easily be measured. Gone are the days of “50% of your marketing is working, you just don’t know which half.” In this series, I’ve outlined some of the top metrics that B2B startups need to account for when measuring marketing. However, those metrics don’t mean much unless stakeholders from marketing, sales and leadership can easily access them and draw conclusions. To make that happen, you need to build dashboards.
Your marketing automation system is typically the tool used to create and view dashboards. As you are getting an initial view of your marketing metrics set up, consider the following:
1. Configure in the marketing automation system, CRM or BI tool
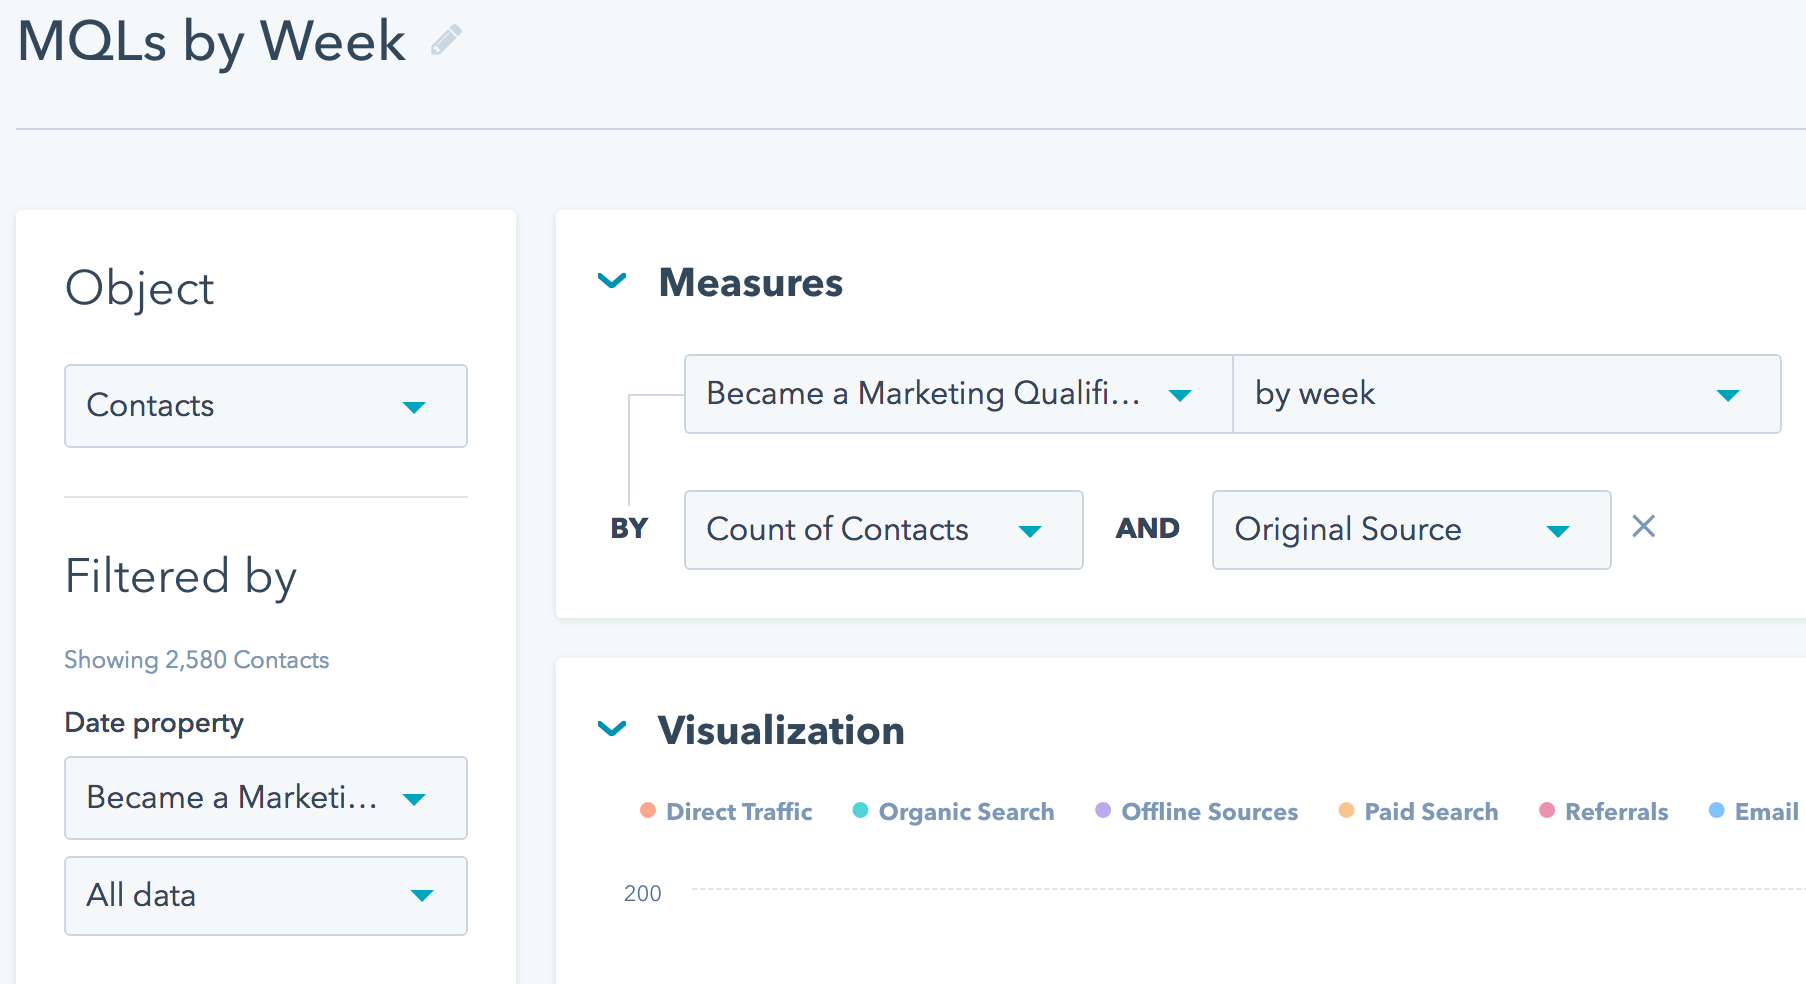
Build your dashboards using the reporting tools in the marketing automation system (e.g. Hubspot), CRM (e.g. Salesforce) or business intelligence (BI) tool (e.g. Birst). Typically this tool is pretty straightforward to use. Here is what Hubspot looks like:
2. Organize by stakeholder group
It’s tempting to make too many charts for every metric on your list. However, you need to stay simple and engineer the dashboard experience so each stakeholder can quickly see metrics that are most relevant for them. I organize dashboards based on functional area with sub groups, such as:
- Marketing
- Demand Generation
- Content
- Sales
- Pipeline
- Closed Deals
This way it’s easy for each viewer of your dashboards to cut through the clutter and get to the data they need.
3. Shoot for automation, but expect some manual work
Most of your dashboards are automatically generated by the marketing stack. However, expect that some metrics may need to be manually compiled or calculated. This is a great task for your intern to run weekly prior to the team meeting.
4. Set up recurring weekly emails
As pretty as you make your dashboards, it’s always challenging to get stakeholders to log into a software tool to look at them. Therefore, recurring weekly emails are ideal. Most tools (like Hubspot and Salesforce) make it easy to generate an auto email to specific stakeholders with specific dashboards each week. I have that email run the night before the team meeting so everyone has a chance to review the metrics and use them to guide the discussion.
5. Leverage integrations to track attribution down the funnel
In some cases, a dashboard might have some metrics that live in marketing automation and some that live in CRM, but both should be grouped in the same dashboard. In many cases, the integration between your systems can bridge that gap and pull in the metrics needed from CRM to marketing automation. Otherwise, this is a good example of the need to compile some metrics manually.
6. Consider reports over charts
While visualizations are certainly an important aspect of dashboards, do not overlook the power of a tabular report with summaries at the bottom. When I’m looking at sales metrics (e.g. funnel by rep or MQL conversions), I actually prefer to get to the granular details in a table because it is easier for me to understand the numbers.
7. Keep them simple
Lastly, strive to keep dashboards simple. Many marketing automation systems have out of the box templates that cover 80% of the metrics you want to track. Custom build the rest, and as always, avoid reinventing the wheel.